|
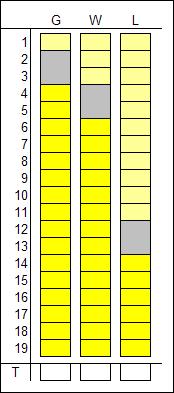
To collect emperial data use this checklist.
The areas in the gray squares are where you
can expect results on average.
|
|
|
Short Summary
|
|
Each ring in Nine Rings will loss 10.56 tickets per game on average, although different rings will fluctuate more than others. The center ring is the most stable, the sides being less stable, and the corners being the most unstable.
|
|
Basic Percentages Table
|
|
Ring Position
|
Grand Prize
|
Runner Up
|
Percent Wins
|
Precent Looses
|
NET Gain (loss)
|
|
Corner
|
11.11% (1/9)
|
22.22% (2/9)
|
33.33%
|
66.67%
|
(33.33%)
|
|
Side
|
11.11% (1/9)
|
33.33% (3/9)
|
44.44%
|
55.56%
|
(11.11%)
|
|
Center
|
11.11% (1/9)
|
44.44% (4/9)
|
55.56%
|
44.44%
|
11.11%
|
|
Winnings - Admission Price
|
|
In each game the amount you win depends what ring position you stand in and if your ring, the ring next to you, or a different ring wins. The table below takes the amount you would win in any ring subtracts the cost of admission.
|
|
Ring Position
|
Grand Prize
|
Runner Up
|
Total Payout
|
Admission
|
NET Gain (loss)
|
|
Corner
|
45
|
5
|
50
|
10
|
40
|
|
Side
|
30
|
5
|
35
|
10
|
25
|
|
Center
|
15
|
5
|
20
|
10
|
10
|
|
Winnings Percentages
|
|
Taking the amount of winnings times the percent of time you can be expected to win that amount yields the following table. This is the result of playing only one game on average.
|
|
Ring Position
|
Grand Prize
|
Runner Up
|
Percent Wins
|
Precent Looses
|
NET Gain (loss)
|
|
Corner
|
5
|
1.11
|
6.11
|
6.67
|
(0.56)
|
|
Side
|
3.33
|
1.67
|
5
|
5.56
|
(0.56)
|
|
Center
|
1.67
|
2.22
|
3.89
|
4.44
|
(0.56)
|
|
Winnings
|
|
If you take the previouse table (results per game) times the number of rounds in a cycle (19), here is the results you would get on average.
|
|
Ring Position
|
Grand Prize
|
Runner Up
|
Lucky Points
|
UnLucky Points
|
NET Gain (loss)
|
|
Corner
|
98.00
|
21.11
|
116.11
|
12.66
|
(10.56)
|
|
Side
|
63.33
|
31.67
|
95.00
|
10.55
|
(10.56)
|
|
Center
|
31.67
|
42.22
|
73.89
|
08.44
|
(10.56)
|
|
Effects on Lucky Unlucky Titles
|
|
If you are playing Nine Rings you are probably working on your Lucky and Unlucky tiles. Assuming you are playing with only 250 tickets, you will only be able to play 23 (250 tickets / 10.56 average number of tickets lost per cycle) cycles (437 games). The table below shows you how this will affect your titles. This data suggests that by using a corner ring position you can progress both your lucky and unlucky titles faster than any other ring position.
|
|
Ring Position
|
Grand Prize
|
Runner Up
|
Lucky Points
|
Unlucky Points
|
NET Gain (loss)
|
|
Corner
|
2254.00
|
485.53
|
2670.53
|
291.18
|
(242.88)
|
|
Side
|
1456.59
|
728.41
|
2185.00
|
242.65
|
(242.88)
|
|
Center
|
728.41
|
971.06
|
1699.47
|
194.12
|
(242.88)
|
|
Sample Data
|
|
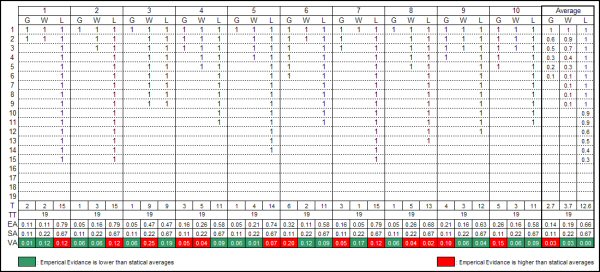
Here are 10 samples I choose at random to conduct some calculations on. Each of these samples came from the same corner ring opposite from the MC. In the below chart, the Red squares are areas where the empirical evidence had a higher value then what you would expect from the statistical information. Green squares are areas where the statistical value was higher than the empirical value. The total variation is less than 3% and it can be assumed that with a larger sample size the 3% error would dissipate. Also of interest is that you can see how in each additional round of Nine Rings the percent of Grand Prize, Runners-Up, and Losses decrease. If we knew the order in which the winnings were allocated it may be possible to determine if there is a “sweet spot” to enter the game and exit rather then stay in full cycle. Sort of playing the stock market.
|
|
|
|
|

