What is this?[edit]
This is a recording of playtime each Alliance Battles map received for weeks of March 2, March 9, and March 23.
I've noticed that most of the time AB seems to be on Grenz and decided to gather some statistical evidence to confirm that. These charts should be mostly self-explanatory. I checked the AB map in each time slot (the map changes every 3 hours) and recorded it. "S/G/A", etc, means that I wasn't able to check the map in that time slot, so I filled in as many cells as possible based on the adjacent map. For example, S/G/A stands for Saltspray/Grenz/Ancestral, which were the only three possible maps for that slot because the one next to it is Grenz.
Observations[edit]


Analysis[edit]
 |
|
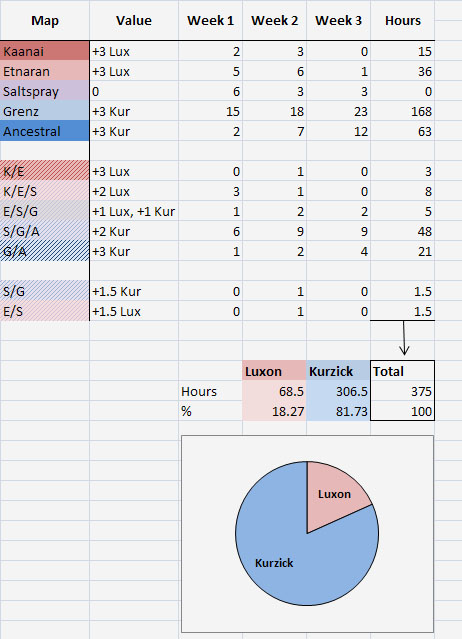
To estimate "AB dominance" I assigned each of the recordings a value to represent hours the battle line spent in the corresponding faction's territory. For example, Grenz Frontier is +3 hours for Kurzicks.
S/G/A is +2 hours for Kurzicks because statistically 2 out of every 3 SGA's would in reality be in Kurzick territory and the third one would be on Saltspray (which has a value of 0). Et cetera. Grey cells (no data) are excluded.
Week 1/Week 2/Week 3 is just a numerical representation of the first three charts. "Hours" is the total number of hours of playtime on each map in 3 weeks, calculated by Value*(Week1+Week2+Week3). |
Map-by-map Breakdown[edit]
 |
|
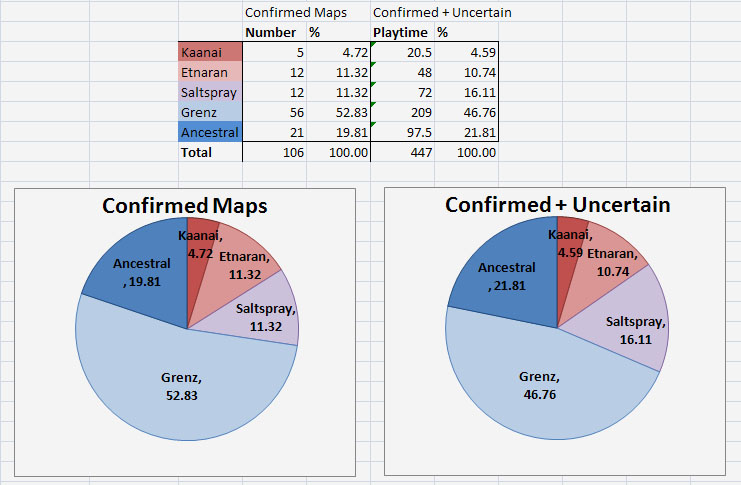
A chart of playtime each map received during the above three weeks.
"Confirmed Maps" chart simply shows the added up numbers for each map. Unconfirmed maps (SGA, etc) are discarded. Values on the chart are percentages of total playtime.
"Confirmed + Uncertain" adds all of the unconfirmed recordings into the calculation, using basically the same principle as in the Luxon/Kurzick chart above. Each confirmed map counts as 3 hours of playtime for that map. S/G/A counts as 1 hour for Saltspray, 1 hour for Grenz, and 1 hour for Ancestral. G/A is 1.5 hours for Grenz and 1.5 hours for Ancestral. Etc. Values on the chart are percentages of total playtime.
Neither method is 100% accurate, but they provide a reasonable approximation. The real values are somewhere in-between the two charts. |


